Fresh industries and services news from South Dakota
Provided by AGPDynacor Reports Record Quarterly Results for Q1-2026
MONTREAL, May 14, 2026 (GLOBE NEWSWIRE) -- Dynacor Group Inc. (TSX: DNG) (“Dynacor” or the “Corporation”) today announced its unaudited financial and operational results1 for the first quarter ended March 31, 2026.
“We delivered a strong start to the year that tracks both our operational and expansion plans,” said Jean Martineau, President & CEO. “Operations maintained strong ore supply momentum, which, coupled with higher recoveries, resulted in record first-quarter production volumes. Supported by the higher gold pricing, this operational outperformance translated into record earnings per share and operating cash flow. With initial production from two new plants set to come online this year, including the first from Senegal later this quarter, we remain firmly on track to deliver stronger production in the second half of the year and achieve our full-year guidance.”
Q1-2026 Highlights
-
Excellent operational performance, driven by stable feed and improved recoveries:
- At-capacity processing for a total of 46,655 tonnes of ore.
- Production of 32,791 AuEq ounces, setting a first-quarter historical record.
-
Excellent financial results due to strong operations and higher realized gold prices:
- Record sales of $154.1 million in Q1-2026 compared to $80.0 million in Q1-2025.
- Record gross margin of $17.4 million (11.3% of sales) in Q1-2026, compared to $9.0 million (11.2% of sales) in Q1-2025.
- Record EBITDA2 of $13.6 million, compared to $7.3 million in Q1-2025, including $0.8 million in non-recurring expenses.
- Record net income of $7.3 million, compared to $5.1 million in Q1-2025.
- Record operating cash flows before changes in working capital items of $10.1 million, compared to $5.8 million in Q1-2025.
- Record cash gross operating margin of $578 per AuEq ounce sold3.
- Record cash flows from operating activities before changes in working capital per share of 0.24$ in Q1-2026 compared to 0.15$ in Q1-2025.
-
Steady execution of international expansion:
- Senegal: 50-tpd pilot plant approximately 85% complete, key equipment delivered and permits secured, and initial agreements for ore supply are in place for Q2-2026 targeted commissioning.
- Ecuador: Upgrade of Svetlana plant infrastructure launched (tailings dam, ball mill and crushing area), most long lead equipment ordered and permitting underway, with first production expected in Q4-2026.
- Continued focus on shareholder returns: Disbursed a monthly dividend representing CA$0.16 per share on an annual basis or a 2.7 % dividend yield based on the current share price.
-
Planned CEO succession: Mr. Jean Martineau to step down following June 2026 annual general meeting (AGM) and be succeeded by Mr. Daniel Misiano, currently Chief Operating Officer.
Senegal
The 50-tpd pilot plant in Kédougou continues to advance on schedule. Concrete work on the modular processing plant is near-complete, and erection of structural steel is advancing well in the crushing and grinding areas. Construction of the processing plant is about 85% complete, and civil works for the ball mill module have ended. Procurement is almost complete, with most equipment on site already. Mechanical installation of the crushing area is ongoing, and all required permits are in place to begin commissioning in Q2-2026.
Laboratory and tailings status: The laboratory is near-complete, and cold commissioning has begun while awaiting the initial ore samples. The tailings storage facility (TSF) cell is almost complete, and placement of the geomembrane has begun
.
Operational readiness: Dynacor is recruiting local operations and technical teams to support the plant start. Initial agreements have been made with local ore suppliers for the pre-commissioning stockpile.
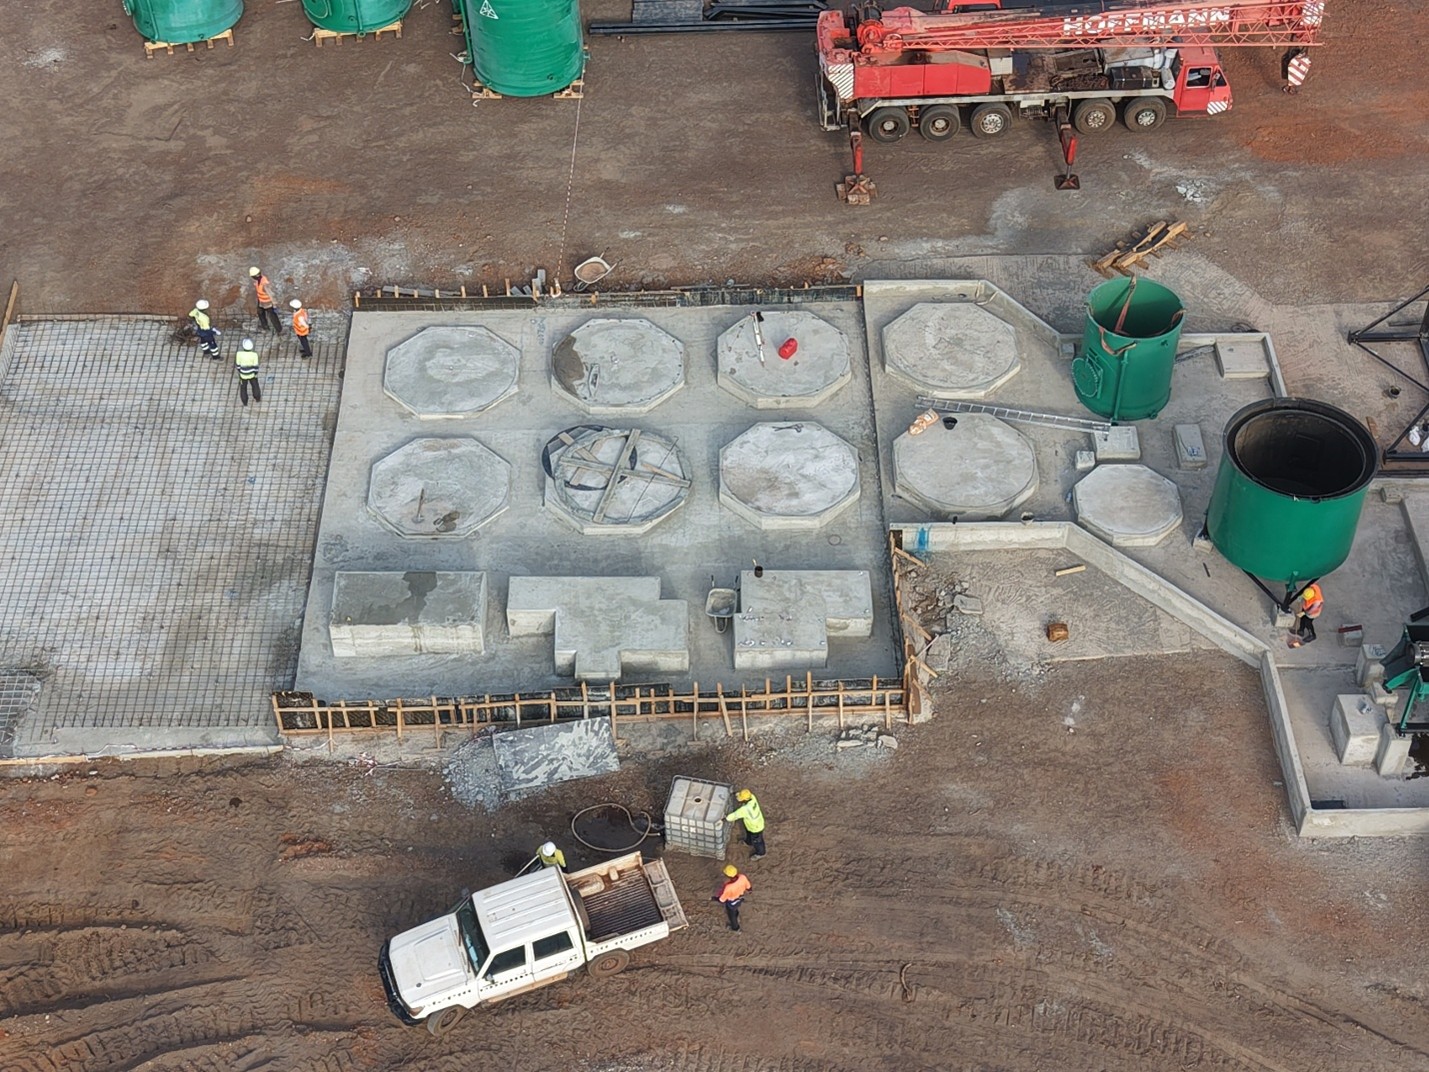
Figure 1: Leach tank work advancing at the Senegal modular pilot plant.
Ecuador
On July 14, 2025, the Corporation completed the acquisition of 100% of the shares of the Svetlana processing plant and related assets for a total cash consideration of $9.75 million. The acquisition includes plans to upgrade and ramp up the facility to a production capacity of 300 tpd, before progressively increasing to 500 tpd. Integration and upgrade work is progressing well with the aim of processing first ore in Q4-2026.
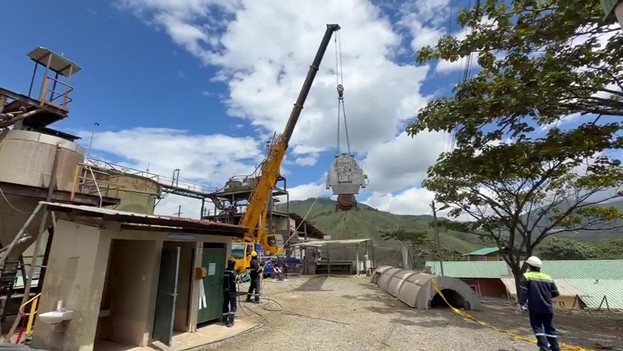
Figure 2: Replacing the carbon regeneration kiln at Svetlana in Ecuador.
Processing plant upgrade: Work on the plant infrastructure was launched in the quarter with the mechanical and electrical constructor teams both mobilised on site. Refurbishment of the crushing area is ongoing including fitting of new chutes and a conveyor belt. An audit of the ball mill has been completed. Most long-lead items have been secured. Local recruitment has commenced.
Civil engineering work has begun for the remediation of the two decommissioned tailings storage facilities (TSFs) and the upgrade of the third active TSF.
Dynacor has applied for a commercialization permit and expects to submit its application for an Investment Protection Agreement shortly with the government of Ecuador. All required permits should be in place in Q4 2026.
2026 Outlook versus Actuals
At quarter-end, the Corporation’s performance was tracking its 2026 guidance:
- Sales between $530-$580 million (YTD $154.1 million).
- Net income between $22-$26 million (YTD $7.3 million).
- Production between 125,000-135,000 AuEq ounces (YTD 32,791 AuEq ounces).
- Capital expenditure of $32.5-$39 million to achieve the 2026 growth plan and sustain Peru operations (YTD $3.9 million) of which $22-$25 million in Ecuador, $6-$8 million in Peru,
$4-$5 million in Senegal and $0.5-$1 million in other jurisdictions.
A number of assumptions were made in preparing the 2026 outlook including
- Production range includes first ore from the Senegal and Ecuador plants. This estimate assumes that the Svetlana plant processes first ore in Q4-2026 and that operations exit the year at a throughput rate of approximately 150 tpd.
- Price of gold: $4,200 per ounce
- No increase in installed operating capacity in Peru and steady ore supply.
- The ore grade supplied may vary with the evolution of the gold price and the purchasing conditions. Final purchasing conditions in Ecuador and Senegal are yet to be determined.
As most of the Corporation's cost of sales relate to the daily purchasing of ore, its margin (and net income) is impacted by the inventory level at quarter-start, the favourable, gradual appreciation of the gold price, and by the ore supply in the period.
Operations Overview
| For the three-month periods ended March 31, |
||
| 2026 | 2025 | |
| Volume processed (in tonnes) | 46,655 | 43,341 |
| Tonnes per day (tpd) | 518 | 482 |
| AuEq ounces produced | 32,791 | 27,050 |
- During Q1-2026, the Corporation processed nearly 46,700 tonnes (518 tpd on average), at the higher end of its historical range, reflecting increased throughput compared to Q1-2025.
- Strong production in Q1-2026 was mainly driven by higher tonnes processed and higher recoveries compared to Q1-2025.
Financial Overview
|
For the three-month periods ended March 31, |
||||||
| (in $'000) (unaudited) | 2026 | 2025 | ||||
| Sales | 154,087 | 79,968 | ||||
| Cost of sales | (136,695 | ) | (70,992 | ) | ||
| Gross operating margin | 17,392 | 8,976 | ||||
| General and administrative expenses | (3,863 | ) | (2,404 | ) | ||
| Other project expenses | (65 | ) | (475 | ) | ||
| Operating income | 13,464 | 6,097 | ||||
| Financial income (expenses), net | (77 | ) | 210 | |||
| Foreign exchange gain (loss) | (1,026 | ) | 276 | |||
| Income before income taxes | 12,361 | 6,583 | ||||
| Current income tax expense | (4,809 | ) | (1,773 | ) | ||
| Deferred income tax (expense) recovery | (229 | ) | 339 | |||
| Net income and comprehensive income | 7,323 | 5,149 | ||||
| Earnings per share | ||||||
| Basic | $0.17 | $0.13 | ||||
| Diluted | $0.17 | $0.13 | ||||
- During Q1-2026, the gold price increased from approximately $4,700/oz in January to around $5,000/oz in February, before declining sharply during the second half of March to approximately $4,500/oz, and recovering to close to $4,700/oz by month-end. Overall, the stronger prices in the first two months had a favorable impact on results, partially offset by the decline in late March.
- Total sales amounted to $154.1 million compared to $80.0 million in Q1-2025. The $74.1 million increase is explained by the higher average gold sales price (+$62.2 million), in combination with higher quantities of gold ounces sold (+$11.9 million) due to higher tonnage of ore processed.
- The Q1-2026 gross operating margin reached $17.4 million (11.3% of sales) compared to $9.0 million (11.2% of sales) in Q1-2025. Both quarters were impacted by the level and the trend in the gold price.
- General and administrative expenses totaled $3.9 million in Q1-2026 compared to $2.4 million in Q1-2025. The increase is primarily attributable to the expansion of the management team, higher salaries to reinforce management capacity and processes in the context of its international expansion. The increase is also attributable to non-recurring expenses, including professional fees associated with an independent review conducted by an external firm into certain employee practices that were inconsistent with Dynacor’s values.
- Foreign exchange result was mainly impacted by the revaluation of monetary assets and liabilities denominated in Peruvian sol due to fluctuations in the Peruvian sol against the US dollar.
- A $5.0 million income tax expense was also recorded during Q1-2026, compared to $1.4 million in
Q1-2025. The effective tax rate continues to be influenced by the variance throughout the period of the Peruvian sol against the US$, which is the Corporation’s functional currency. Future fluctuations will positively or negatively affect the current and deferred tax at the end of each period.
Cash Flows, Working Capital and Liquidity Overview
|
For the three-month periods ended March 31, |
||||
| (in $'000) (unaudited) | 2026 | 2025 | ||
| Operating activities | ||||
| Net income, adjusted for non-cash items | 10,070 | 5,799 | ||
| Changes in working capital items | (7,216 | ) | 9,686 | |
| Net cash from operating activities | 2,854 | 15,485 | ||
| Investing activities | ||||
| Acquisition of property, plant and equipment, net of proceeds from disposal | (3,908 | ) | (1,304 | ) |
| Net cash used in investing activities | (3,908 | ) | (1,304 | ) |
| Financing activities | ||||
| Issuance of common shares | - | 20,433 | ||
| Dividends paid | (1,230 | ) | (1,115 | ) |
| Other | 73 | 56 | ||
| Net cash from (used in) financing activities | (1,157 | ) | 19,374 | |
| Change in cash during the period | (2,211 | ) | 33,555 | |
| Effect of exchange rate fluctuations on cash | (618 | ) | (76 | ) |
| Cash, beginning of the period | 33,488 | 19,819 | ||
| Cash, end of the period | 30,659 | 53,298 | ||
Investing activities
- In Q1-2026, Dynacor invested $3.9 million in capital expenditure of which $2.4 million was applied toward the construction of the ore-processing pilot plant in Senegal, $0.8 million in Ecuador and
$0.7 million in Peru, mainly to maintain or improve plant efficiency.
Working Capital and Liquidity
- As at March 31, 2026, the Corporation’s working capital amounted to $85.9 million, including $30.7 million in cash ($82.0 million, including $33.5 million in cash as at December 31, 2025).
Consolidated Statement of Financial Position
As at March 31, 2026, total assets amounted to $183.6 million ($181.5 million as at December 31, 2025). Major variances since year-end 2025 come from the increase in inventory and additions to property, plant and equipment, partially offset by the decrease in sales tax receivables. The total liabilities remained generally consistent over the period.
| (in $'000) (unaudited) | As at March 31, | As at December 31, |
| 2026 | 2025 | |
| Cash | 30,659 | 33,488 |
| Accounts receivable | 29,364 | 37,221 |
| Inventories | 49,085 | 39,016 |
| Prepaid expenses and other assets | 1,085 | 516 |
| Current tax assets | 1,846 | 2,158 |
| Property, plant and equipment | 52,153 | 49,442 |
| Exploration and evaluation assets | 18,575 | 18,575 |
| Right-of-use assets | 608 | 625 |
| Deferred tax assets | 190 | 418 |
| Total assets | 183,565 | 181,459 |
| Trade and other payables | 26,135 | 30,417 |
| Asset retirement obligations | 14,886 | 14,830 |
| Lease liabilities | 514 | 520 |
| Share unit plan liabilities | 906 | 790 |
| Shareholders' equity | 141,124 | 134,902 |
| Total liabilities and shareholders’ equity | 183,565 | 181,459 |
About Dynacor
Dynacor Group is an ore processing company dedicated to producing gold sourced from artisanal miners. Since its establishment in 1996, Dynacor has pioneered a responsible mineral supply chain with stringent traceability and audit standards for the fast-growing artisanal mining industry. By focusing on formalized miners, the Canadian company offers a win-win approach for governments and miners globally. Dynacor operates the Veta Dorada plant and owns a gold exploration property in Peru. The company is expanding to West Africa and within Latin America.
The premium paid by luxury jewellers for Dynacor’s PX Impact® gold goes to Fidamar Foundation, an NGO that mainly invests in health and education projects for artisanal mining communities in Peru. Visit www.dynacor.com for more information.
Forward-Looking Information
Certain statements in the preceding may constitute forward-looking statements, which involve known and unknown risks, uncertainties and other factors that may cause the actual results, performance, or achievements of Dynacor, or industry results, to be materially different from any future result, performance or achievement expressed or implied by such forward-looking statements. These statements reflect management’s current expectations regarding future events and operating performance as of the date of this news release.
Contact:
For more information, please contact:
Ruth Hanna
Director, Investor Relations
T: 514-393-9000 #236
E: investors@dynacor.com
Website: http://www.dynacor.com
Renmark Financial Communications Inc.
Bettina Filippone
T: (416) 644-2020 or (212) 812-7680
E: bfilippone@renmarkfinancial.com
Website: www.renmarkfinancial.com
____________________________
1 All figures are in US dollars unless stated otherwise. All variance % are calculated from rounded figures. Some additions might be incorrect due to rounding.
2 EBITDA: “Earnings before interest, taxes and depreciation” is a non-IFRS financial performance measure with no standard definition under IFRS Accounting Standards. It is therefore possible that this measure may not be comparable with a similar measure of another corporation. The Corporation uses this non-IFRS measure as an indicator of the cash generated by the operations and allows investors to compare the profitability of the Corporation with others by canceling effects of different asset bases, effects due to different tax structures as well as the effects of different capital structures. EBITDA is calculated on page 15 of the Corporation’s MD&A for the three-month period ended March 31, 2026, with additional information provided in section 18, “Non-IFRS Measures.”
3 Cash gross operating margin per AuEq ounce is in US$ and is calculated by subtracting the average cash cost of sale per equivalent ounce of Au from the average selling price per equivalent ounce of Au and is a non-IFRS financial performance measure with no standard definition under IFRS Accounting Standards. It is therefore possible that this measure may not be comparable with a similar measure of another company. Cash gross operating margin per AuEq ounce is calculated on page 14 of the Corporation’s MD&A for the three-month period ended March 31, 2026, with additional information provided in section 18, “Non-IFRS Measures.”
Photos accompanying this announcement are available at:
https://www.globenewswire.com/NewsRoom/AttachmentNg/9878e9c3-db45-49d8-acb0-1bd07ce85e15
https://www.globenewswire.com/NewsRoom/AttachmentNg/0e498c4d-f32c-44e4-9607-ef0f54ac07e4

![]()
Figure 1: Leach tank work advancing at the Senegal modular pilot plant.

Figure 1: Leach tank work advancing at the Senegal modular pilot plant.
Figure 2: Replacing the carbon regeneration kiln at Svetlana in Ecuador.

Figure 2: Replacing the carbon regeneration kiln at Svetlana in Ecuador.
Legal Disclaimer:
EIN Presswire provides this news content "as is" without warranty of any kind. We do not accept any responsibility or liability for the accuracy, content, images, videos, licenses, completeness, legality, or reliability of the information contained in this article. If you have any complaints or copyright issues related to this article, kindly contact the author above.
